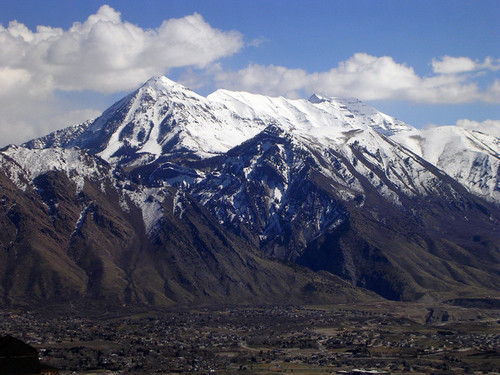
A student noticed an interesting weather phenomena and recorded this question on our question board: If heat rises then why are mountains cold? In Utah, it's common to see snow in the mountains but not in the valley. This intriguing observation inspired the following weather investigation.
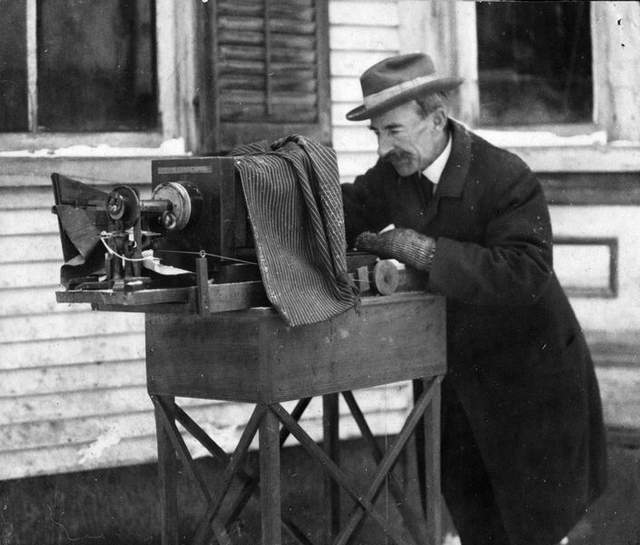
Utah's first snowfall this year came on Christmas morning. (How great is that?) Shortly after students returned from their holiday break, we kicked off our weather investigation by reading a story about a snow scientist named Wilson Bentley. I am always inspired by his perseverance, and his passion for science and photography. He captured images of over 2,000 snowflakes in his lifetime. His work was published in 1931 just two weeks before he died. It was his gift to the world.
Utah's first snowfall this year came on Christmas morning. (How great is that?) Shortly after students returned from their holiday break, we kicked off our weather investigation by reading a story about a snow scientist named Wilson Bentley. I am always inspired by his perseverance, and his passion for science and photography. He captured images of over 2,000 snowflakes in his lifetime. His work was published in 1931 just two weeks before he died. It was his gift to the world.
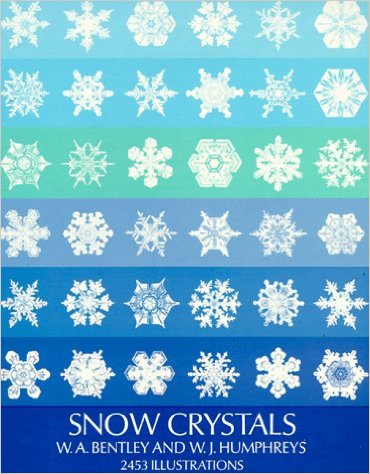
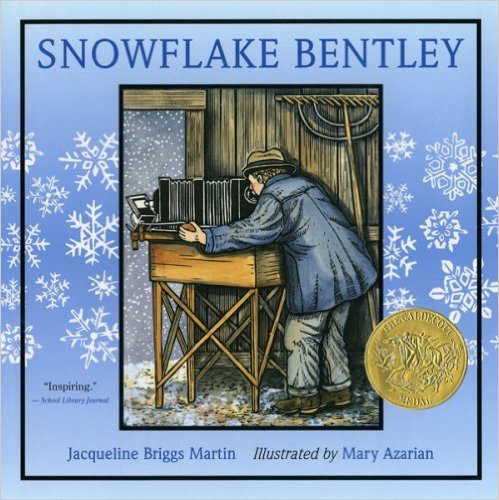
Engage: Working in small groups, students examine a couple illustrations (hand-colored woodcuts) from the book Snowflake Bentley. They first interpret the art then reveal the text, choosing a sentence, phrase, and word that capture the essence. Together students collaboratively tell and build an understanding of the story.
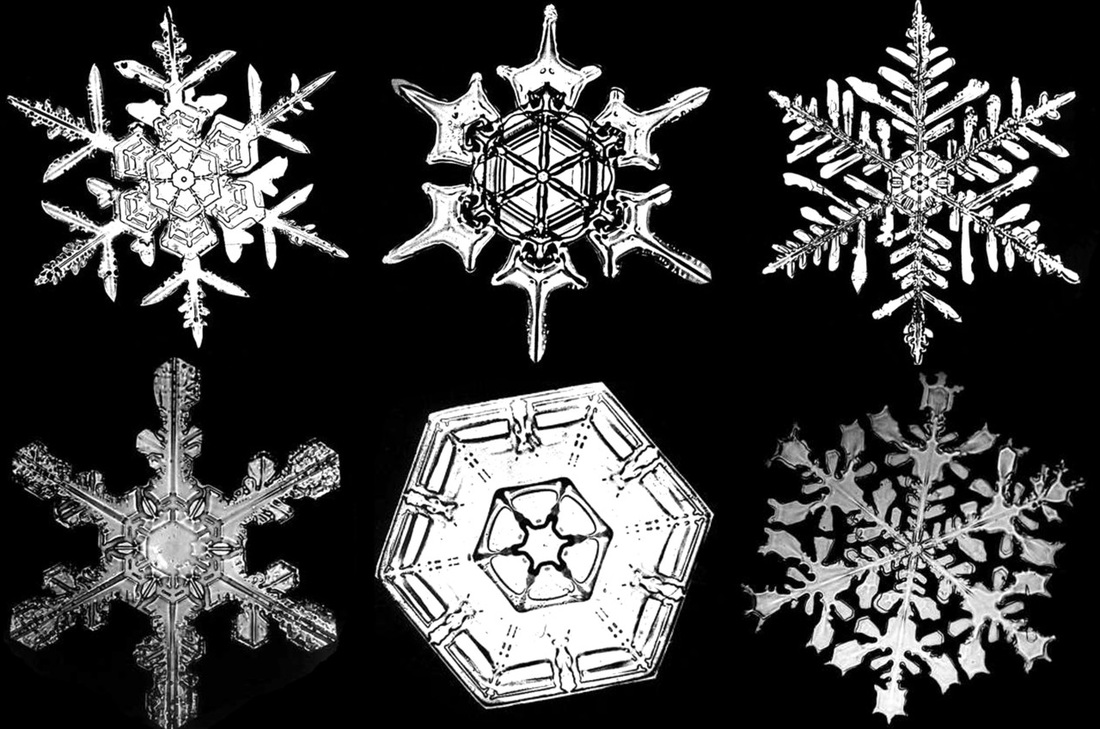
Bentley's original publication of snow crystals is presented. Students silently draw the snowflakes as they reflect on the implications of Bentley's life and work. We wait for the next snow storm to capture some snowflakes of our own. We are curious: How do clouds make snow crystals?
Thinking routines: See, Think, Wonder (illustrations) and Sentence, Phrase, Word (text).
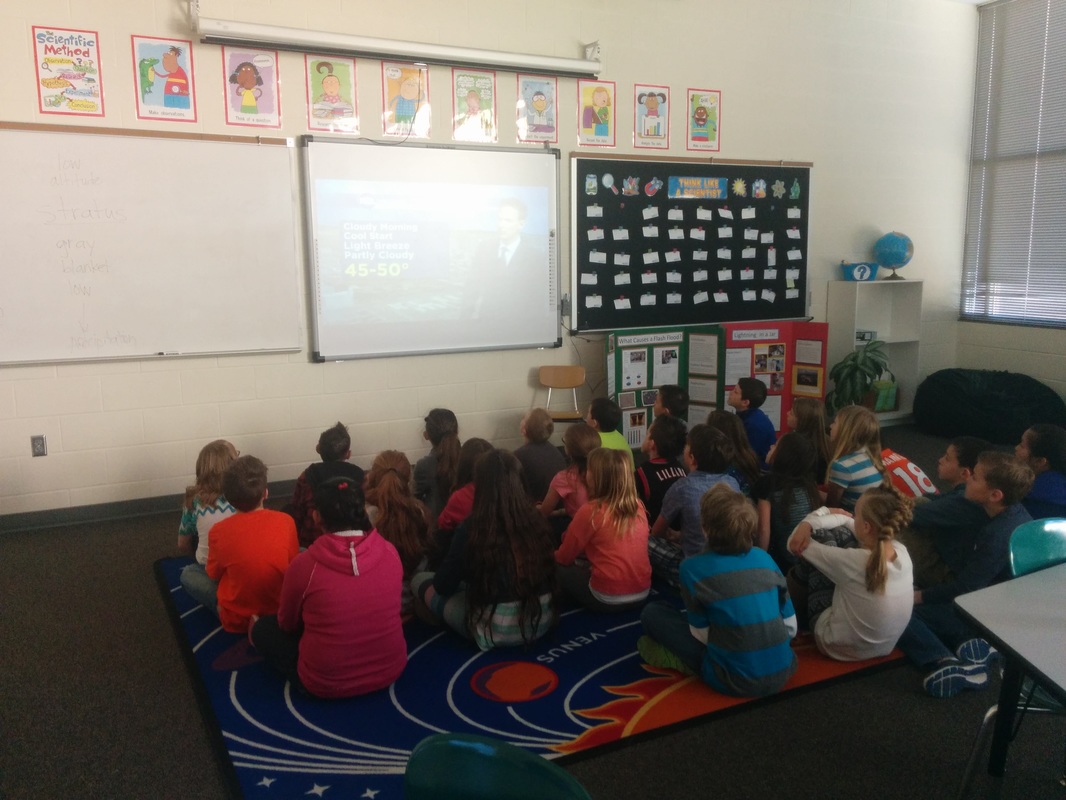
Engage: Students view a weather report listening for key words and phrases. We list the words and phrases on the board to see what big ideas surface. Together we generate questions for our weather investigation: Why does it snow more in the mountains than in the valley? How do meteorologists predict when a storm is coming? What is the relationship between air pressure and temperature?
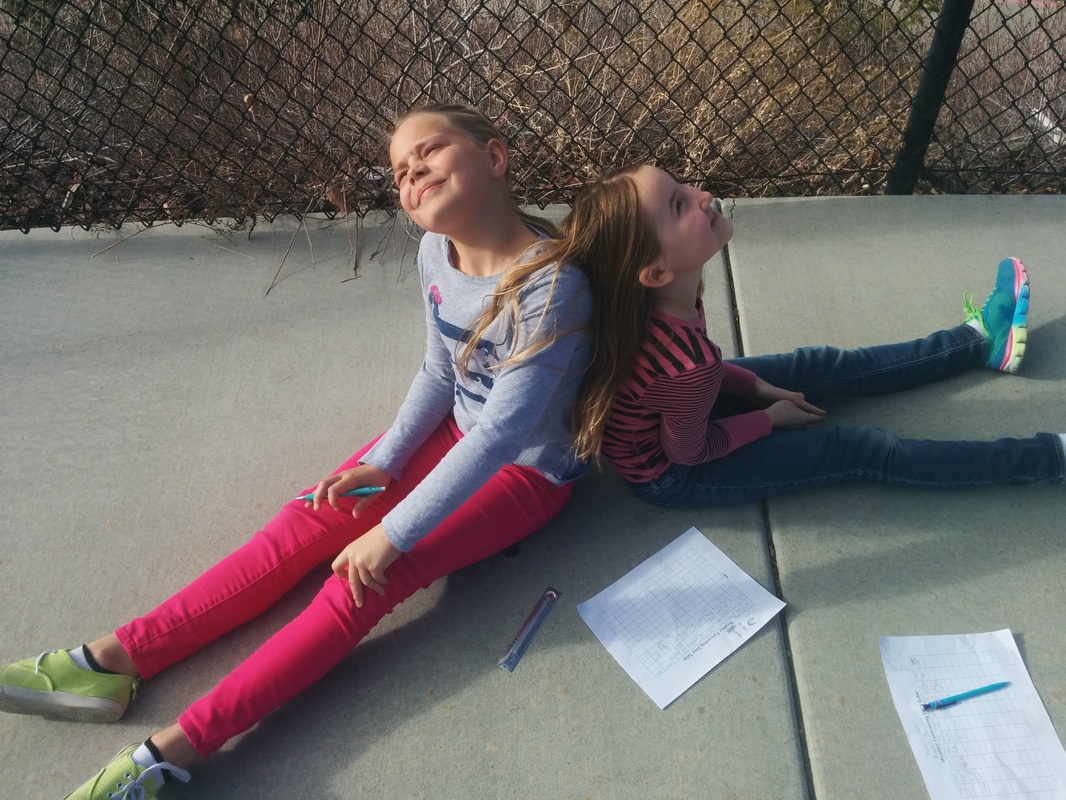
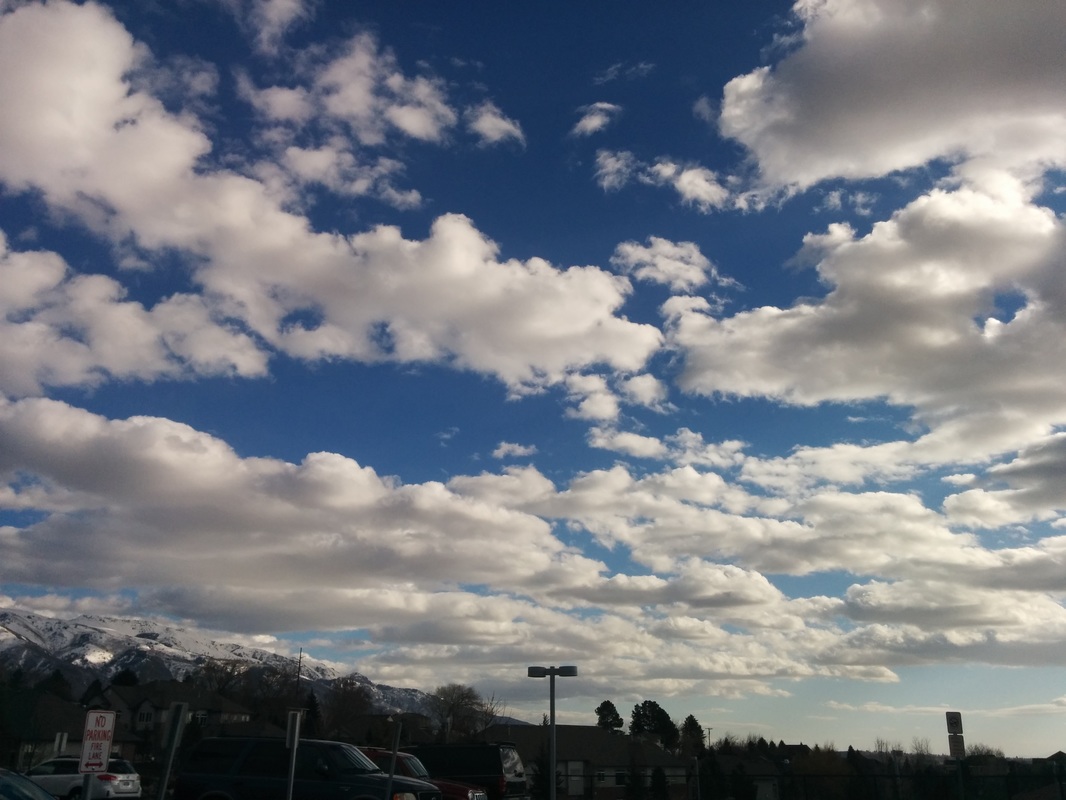
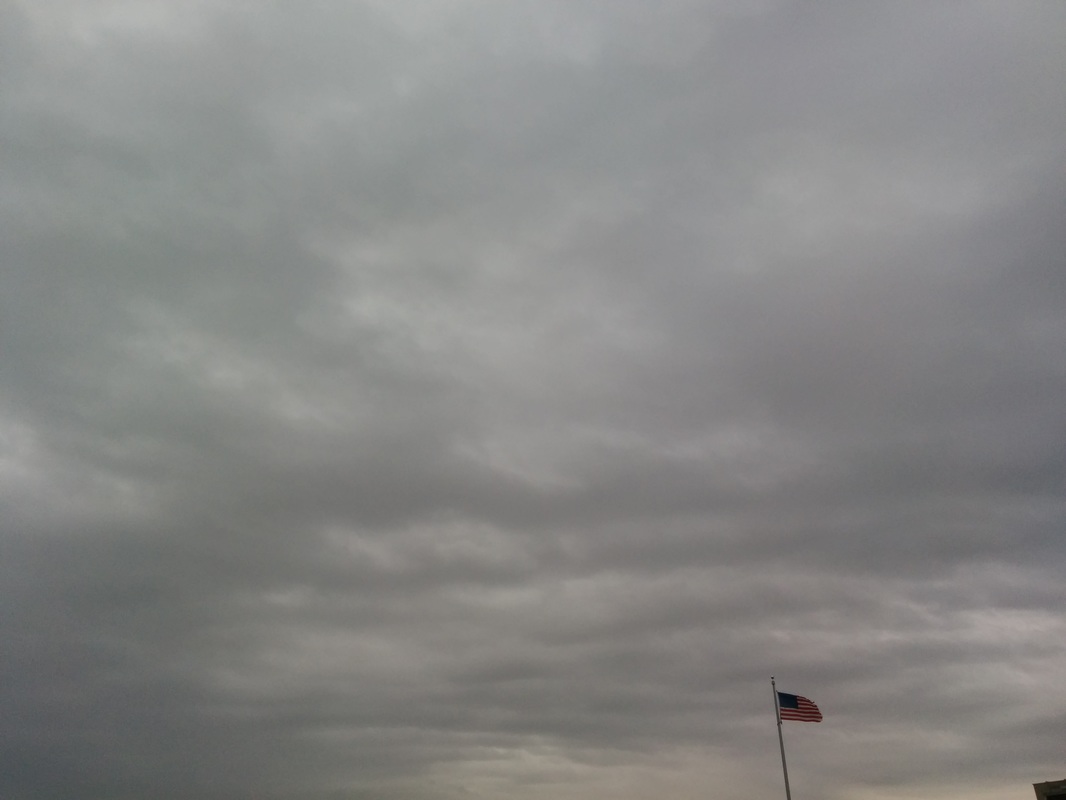
Explore: Students generate a list of basic weather elements they can observe and measure. Students go outside to observe the weather once a week for a month, using weather instruments to collect data for a chart (precipitation, air temperature, air pressure, cloud cover, wind speed and direction). Students also photograph and draw pictures of the clouds. They look for patterns that can be used to make predictions about the weather.
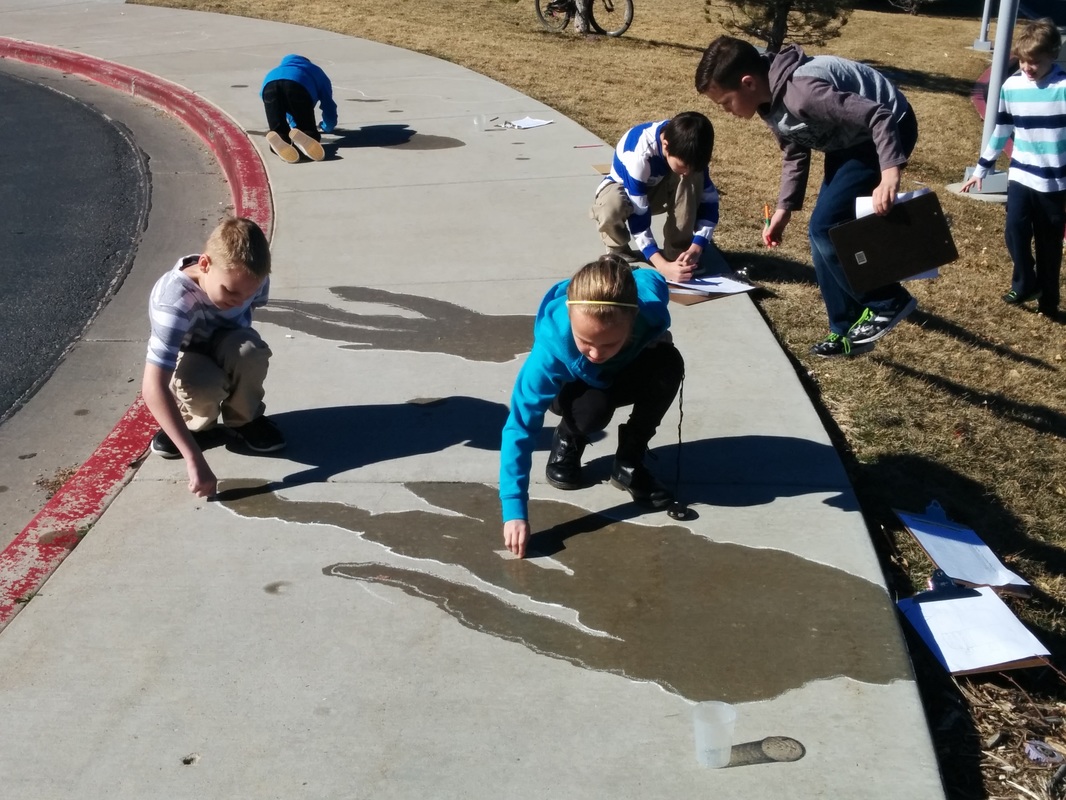
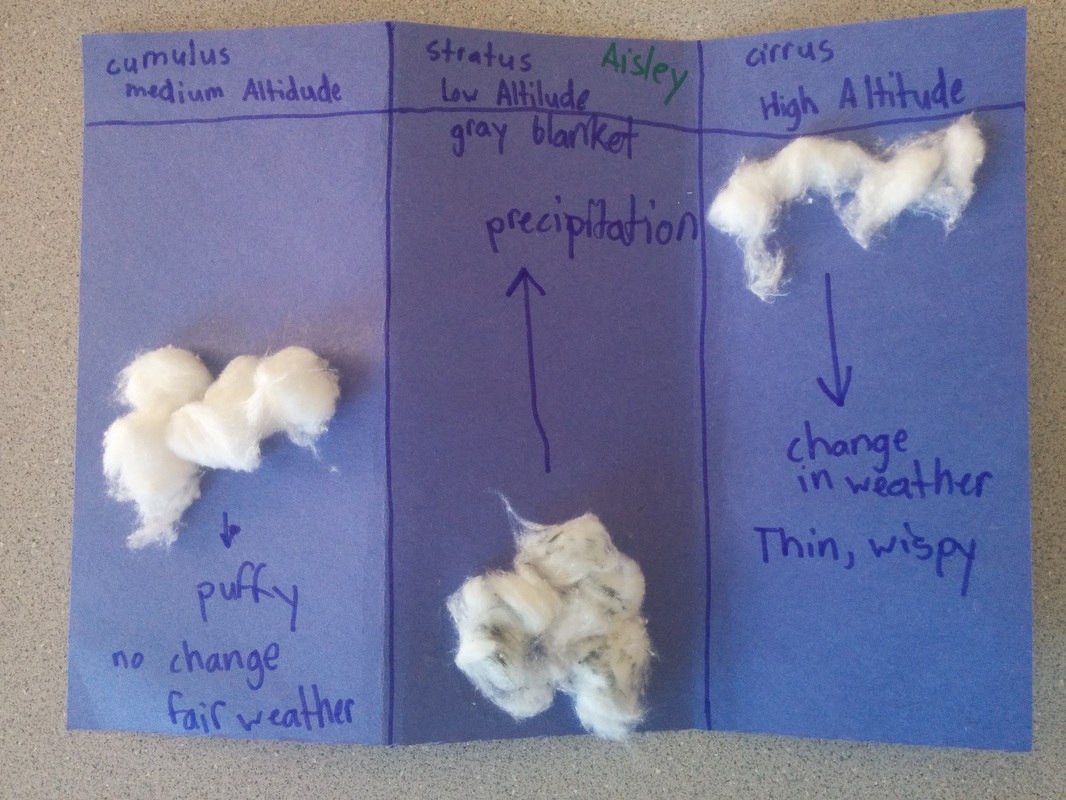
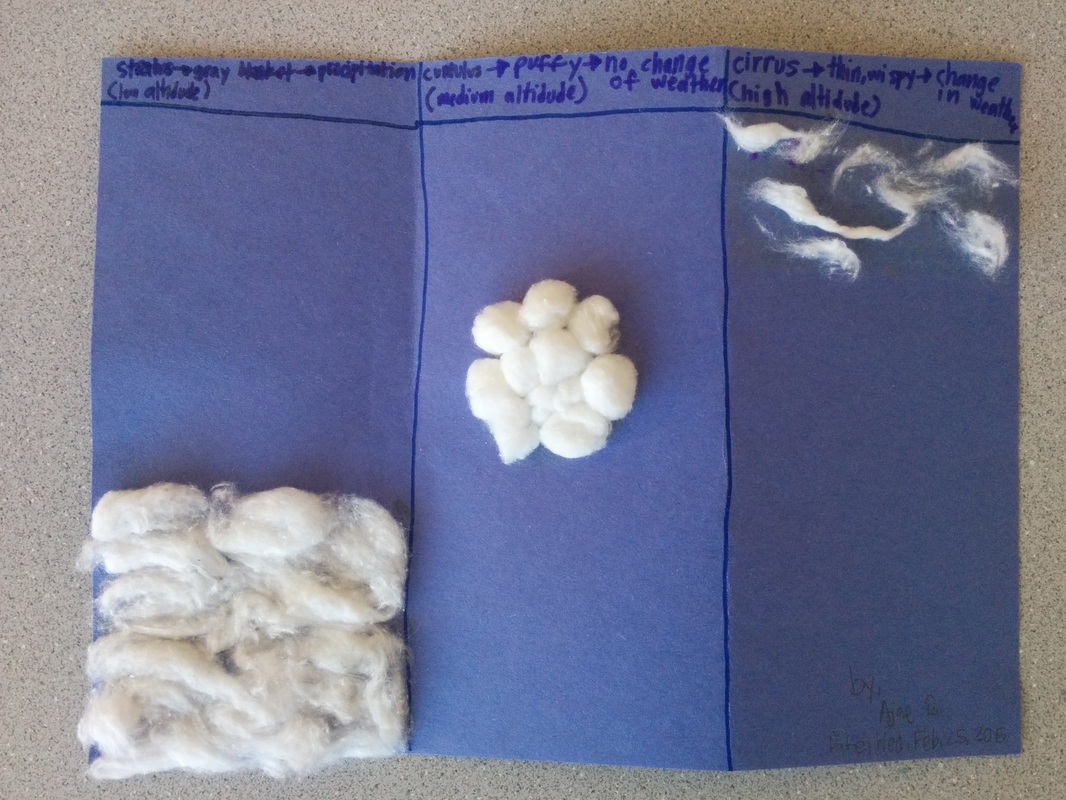

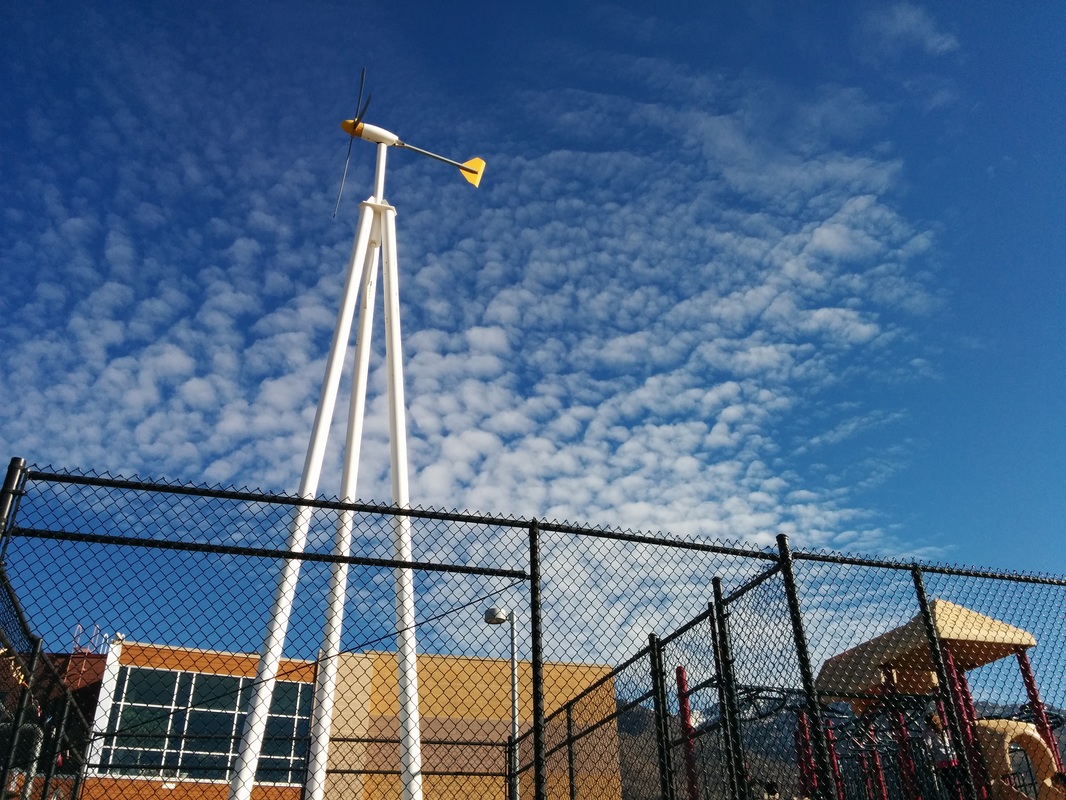
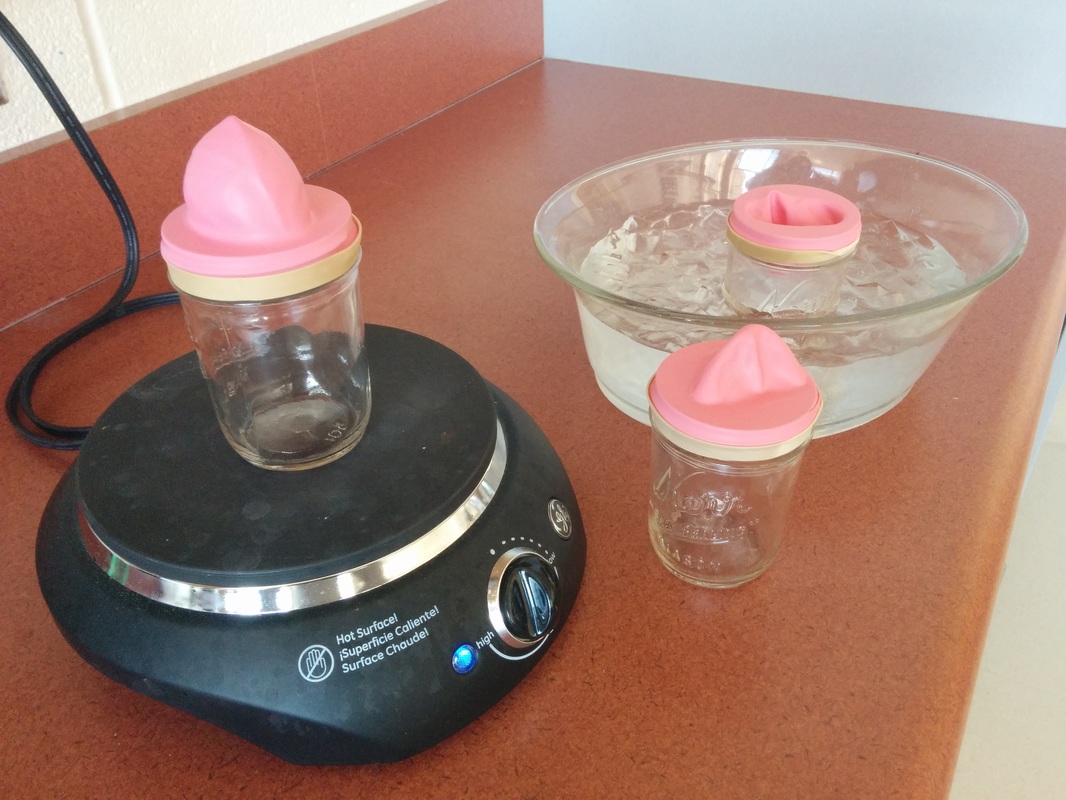
Explore: Students discover that clouds can be used to predict the weather. Using our cloud photos, we identify at least three different kinds of clouds (see Types of Clouds). On a cloudless day, we try to make our own clouds by tracing puddles with chalk and watching the water evaporate. We compare the effect of temperature on evaporation rate (in sunshine and shadow).
Explain: Students observe hot and cold balloons to think about the effect of temperature on air pressure. Students socially construct an explanation for why cold balloons shrink and warm balloons expand. Using the CER model, each student records their explanation in a science notebook. Students also compare what happens when food coloring is dropped into warm vs. cold water then act out the movement of molecules.
In a whole group discussion, we consider how these findings inform our thinking about weather (see Weather Fronts and A Recipe for Wind) and answer our driving question about the effect of elevation on temperature and pressure. Thinking routine: Student Fishbowl.
In a whole group discussion, we consider how these findings inform our thinking about weather (see Weather Fronts and A Recipe for Wind) and answer our driving question about the effect of elevation on temperature and pressure. Thinking routine: Student Fishbowl.
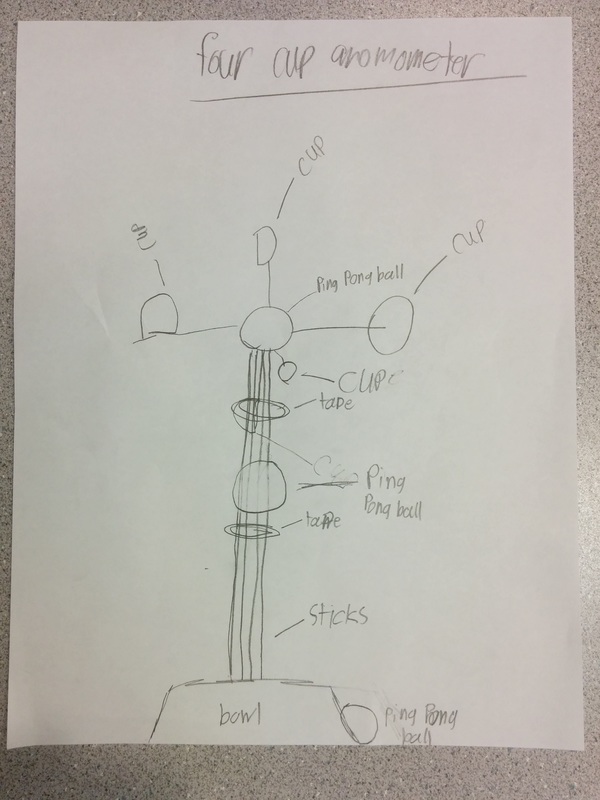
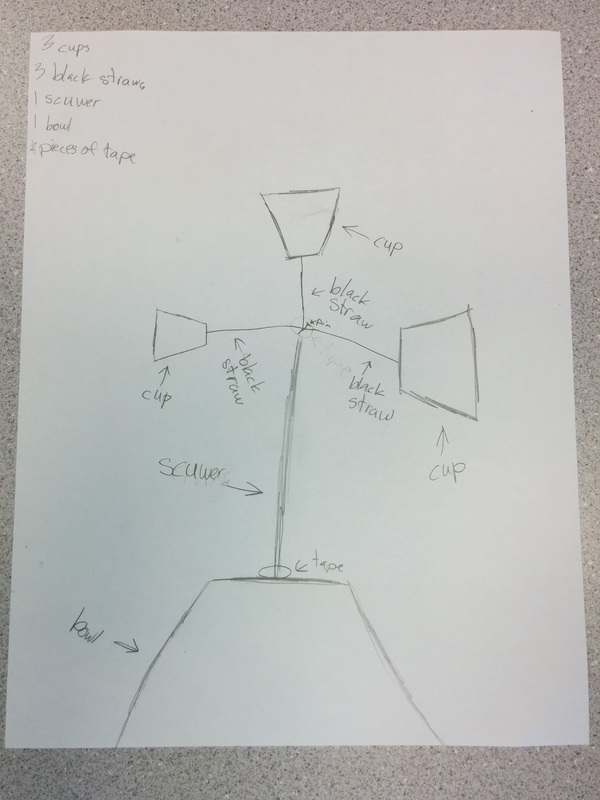
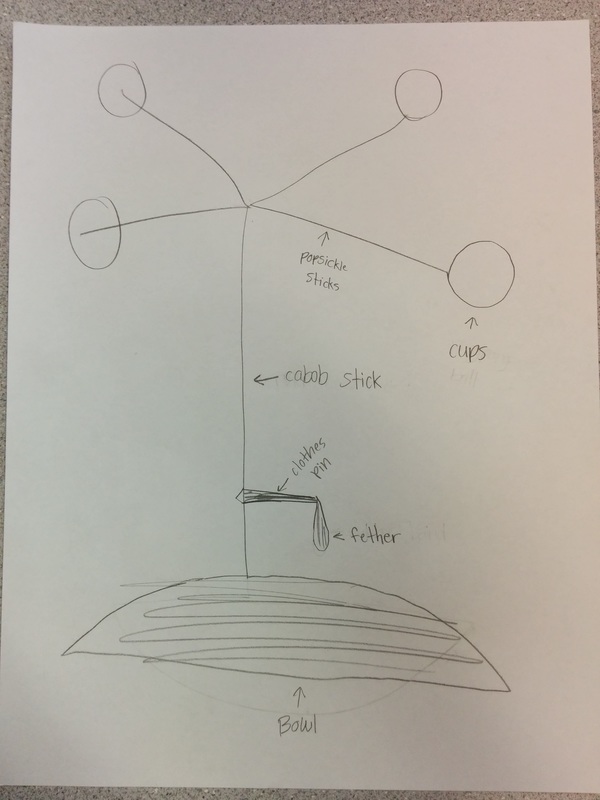
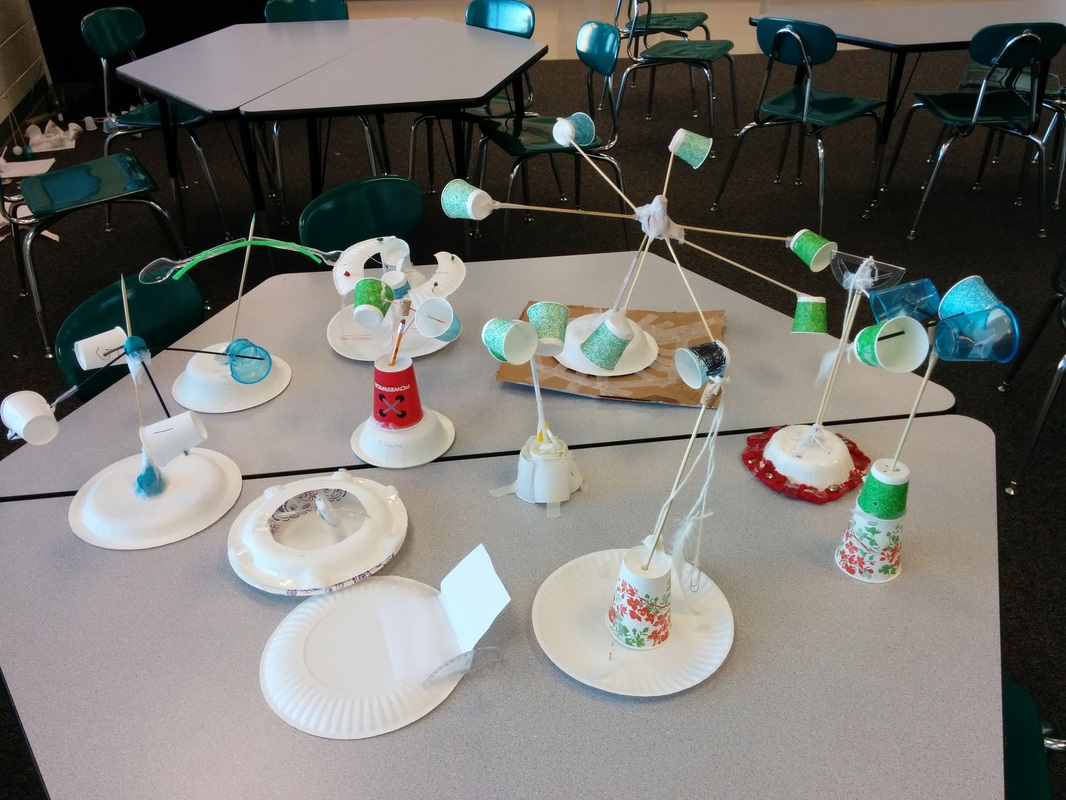
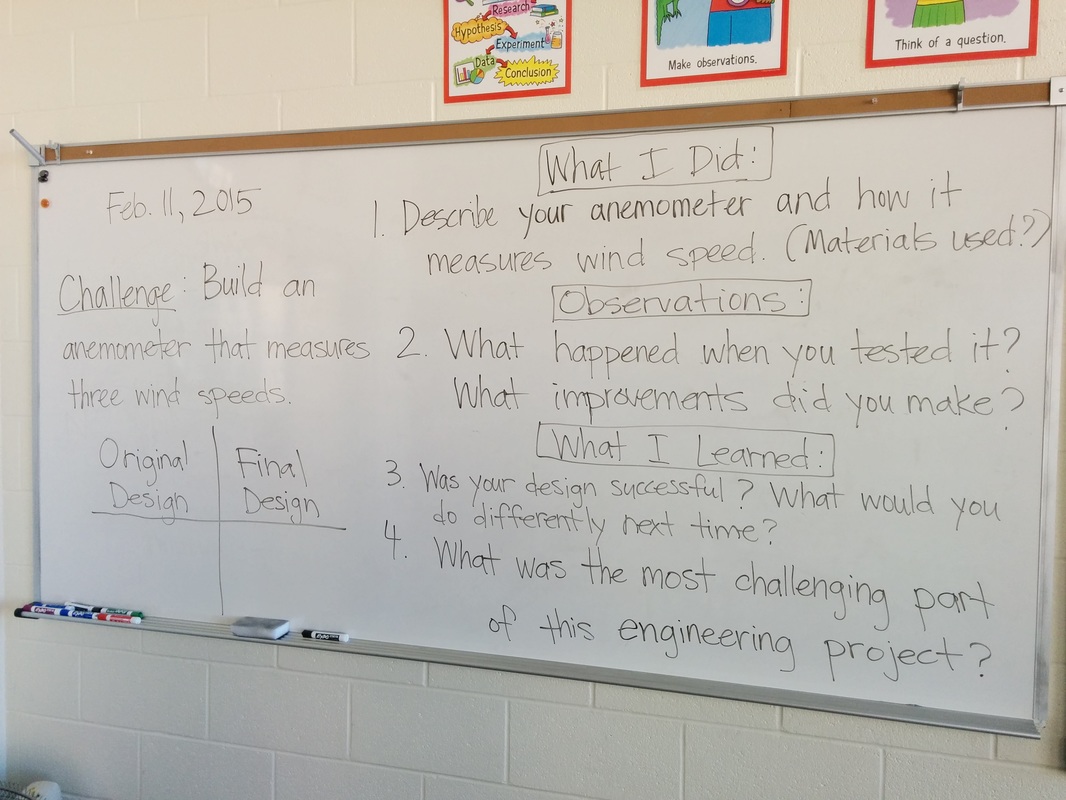
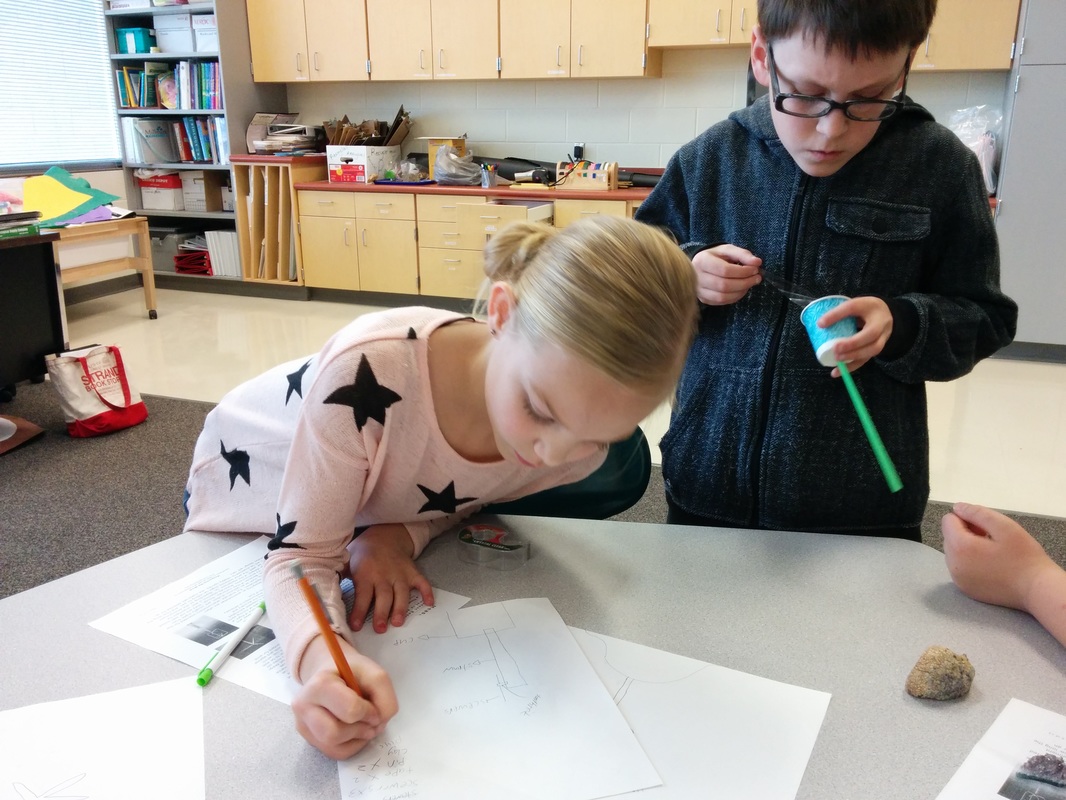
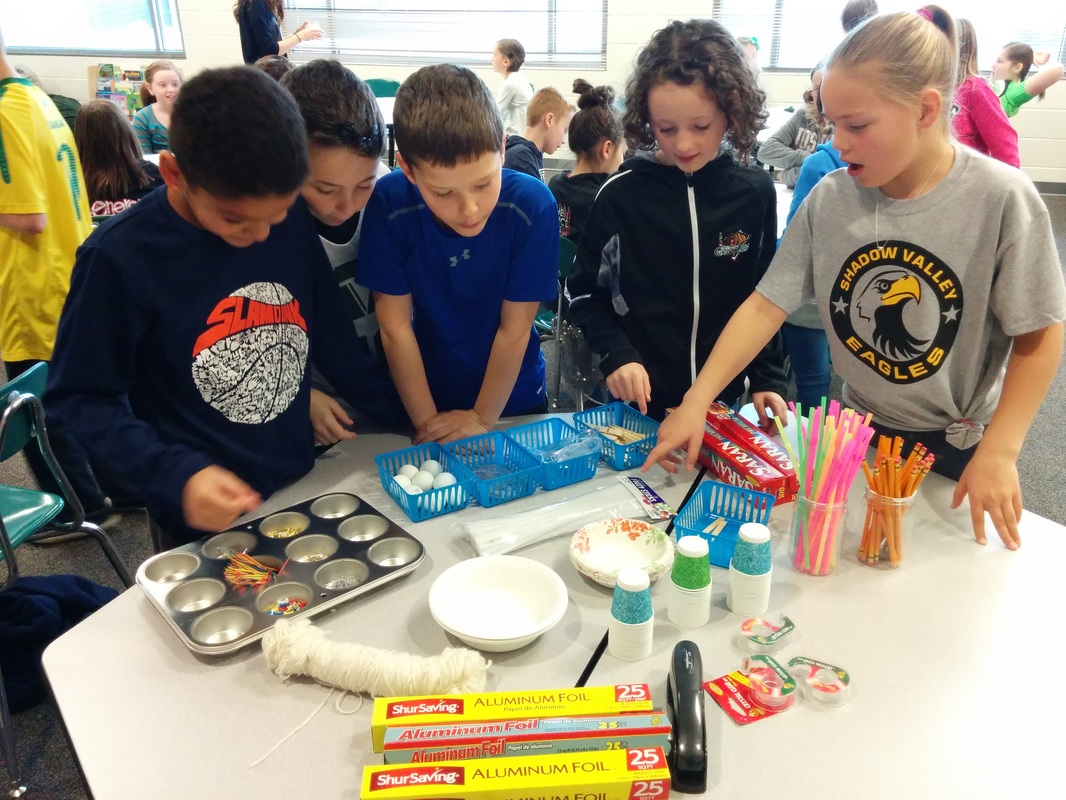
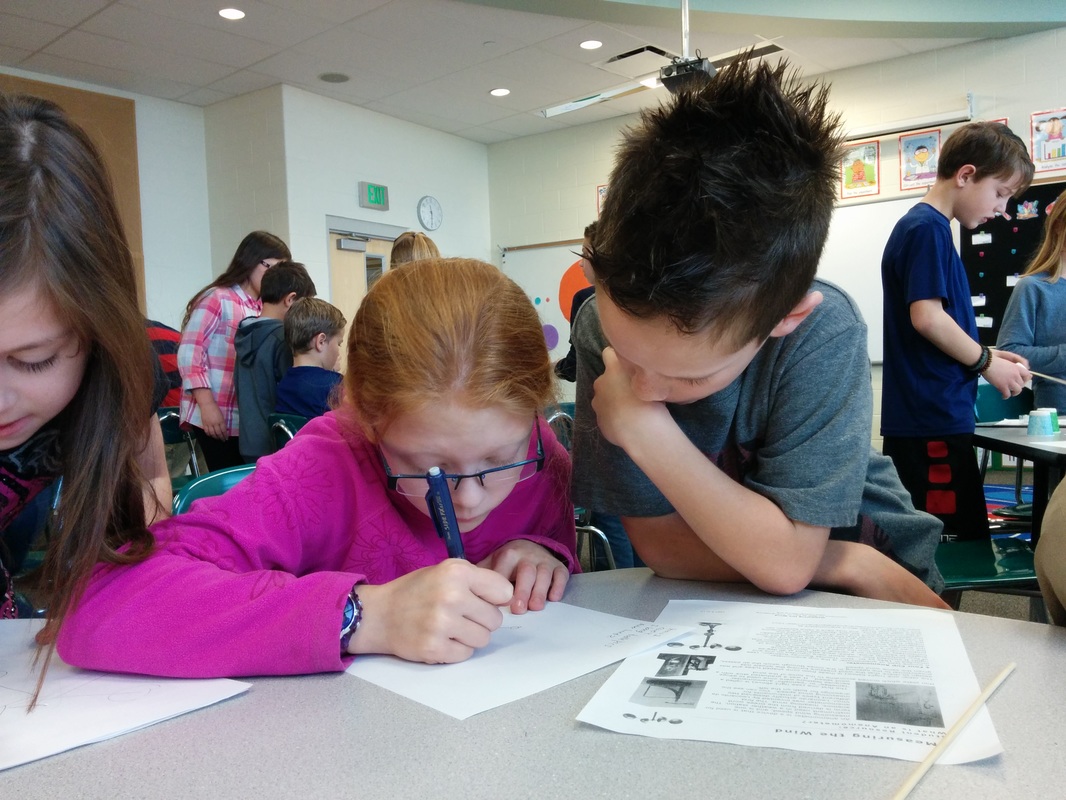
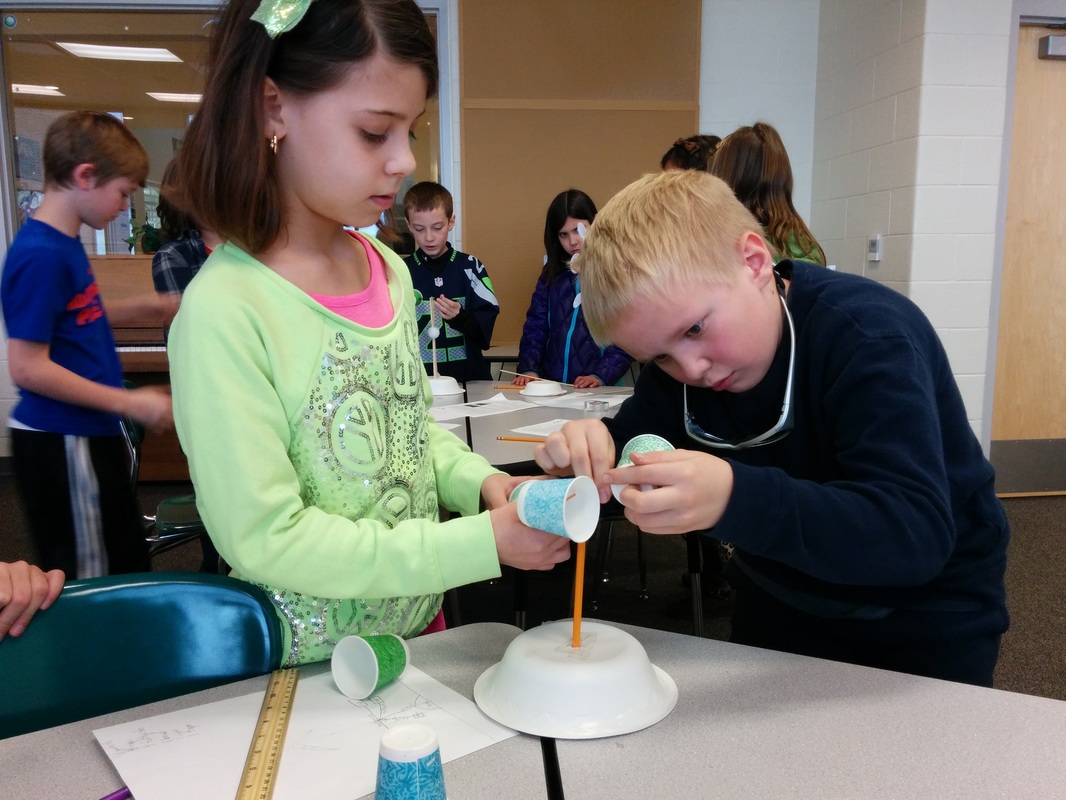
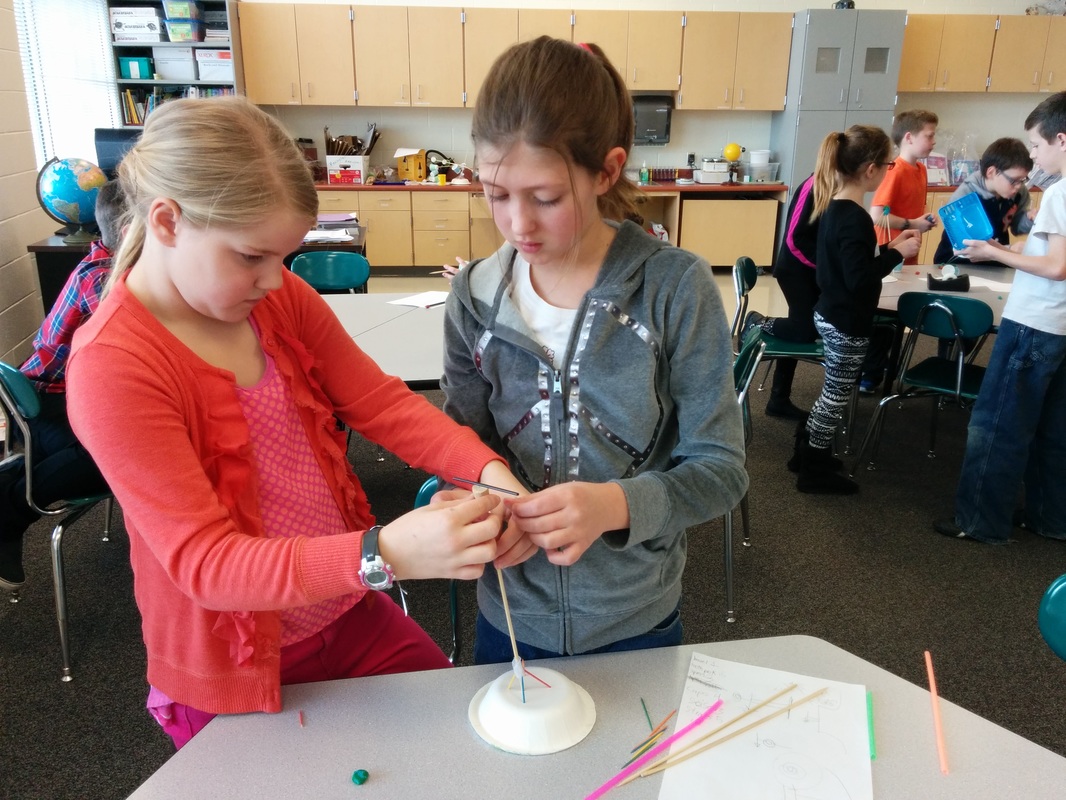
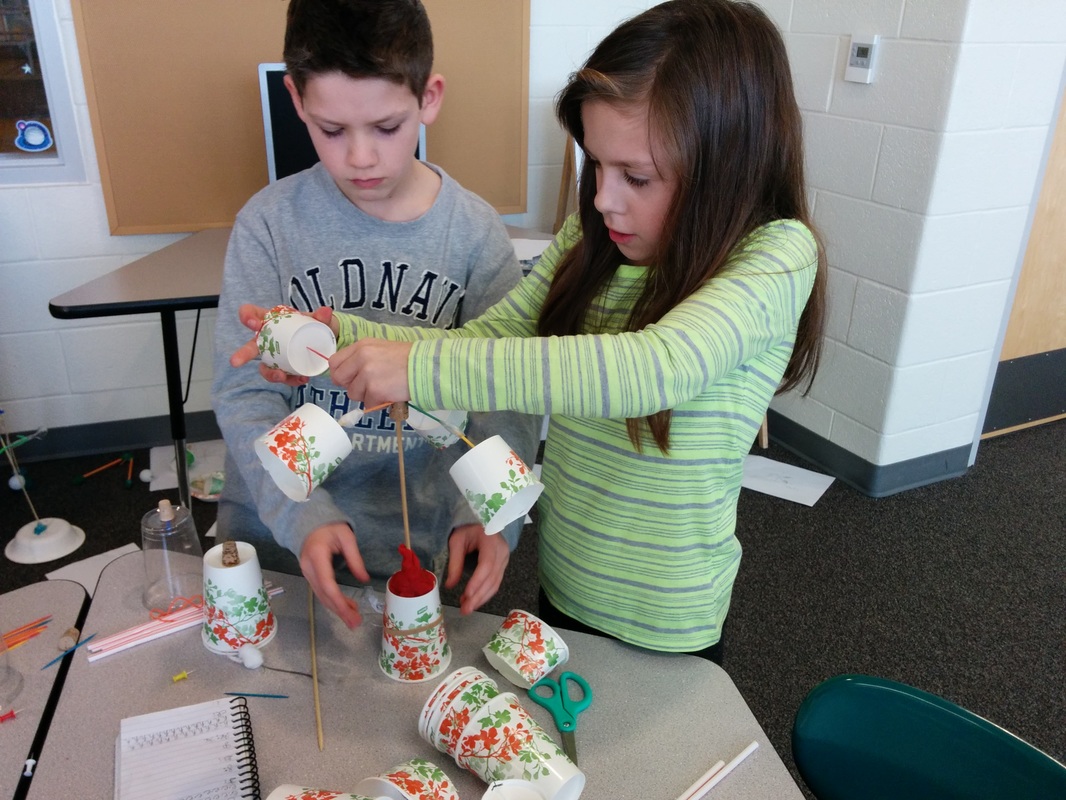
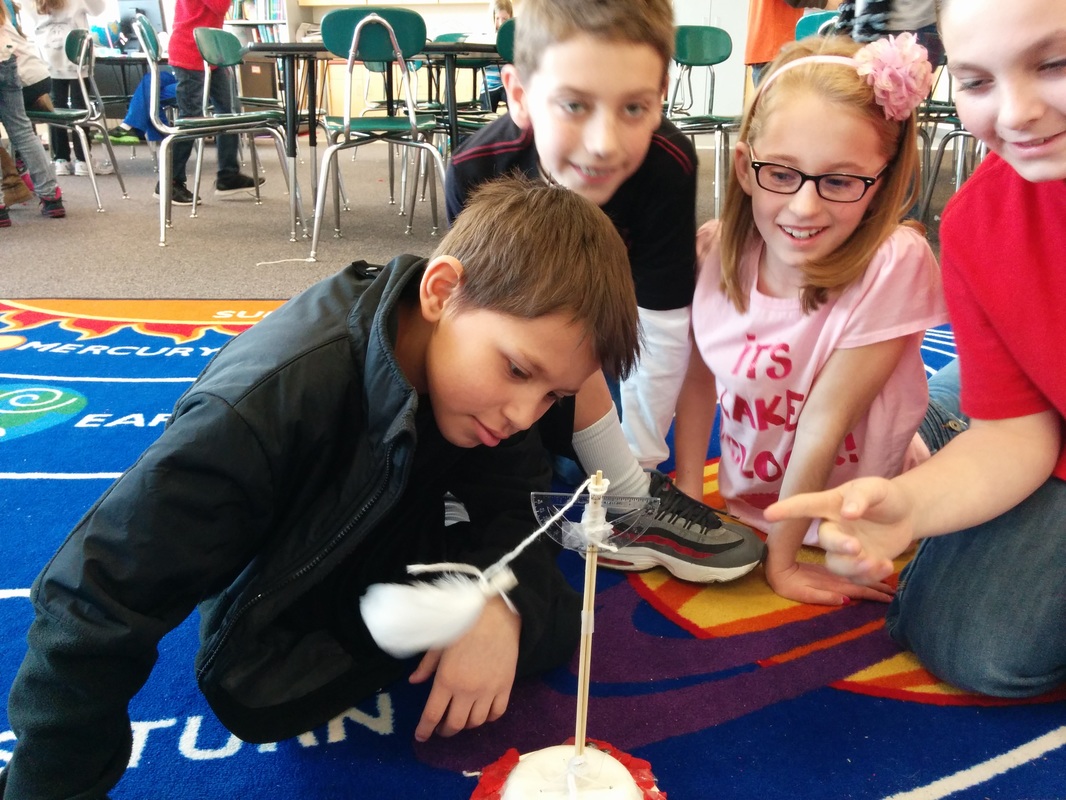
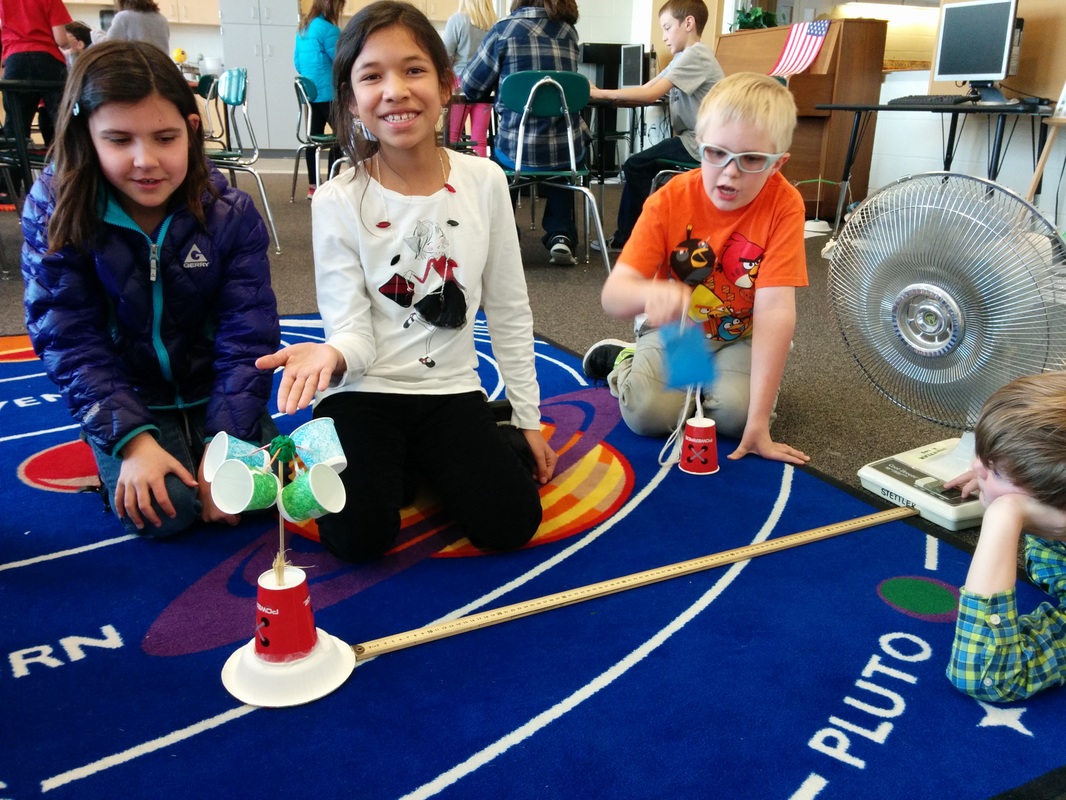
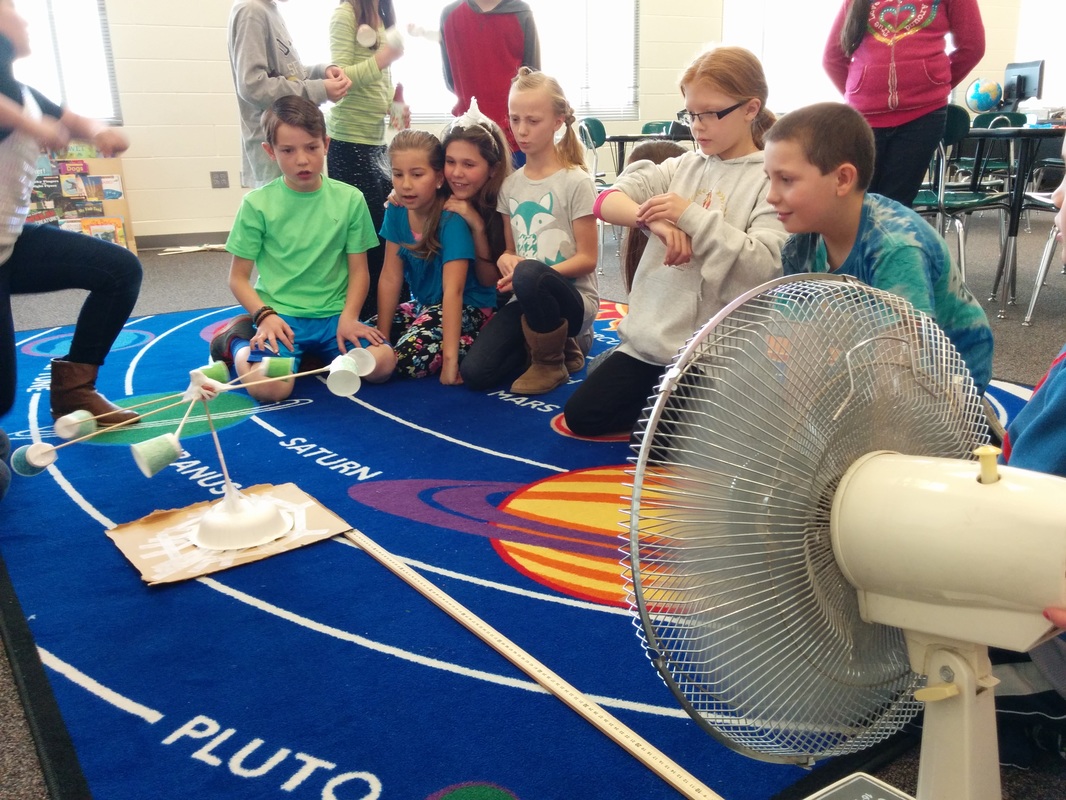
Elaborate: Students compare data for extreme weather on earth and other planets. They learn that NASA is collecting weather data on Mars (learn more), but the instrument designed to measure wind speed was damaged during the rover's landing (reference). Students are invited to do the work of engineers, designing and building an anemometer (hypothetically for the Mars rover). Working in small groups, students plan, build, test, and improve their design then present it to the class.
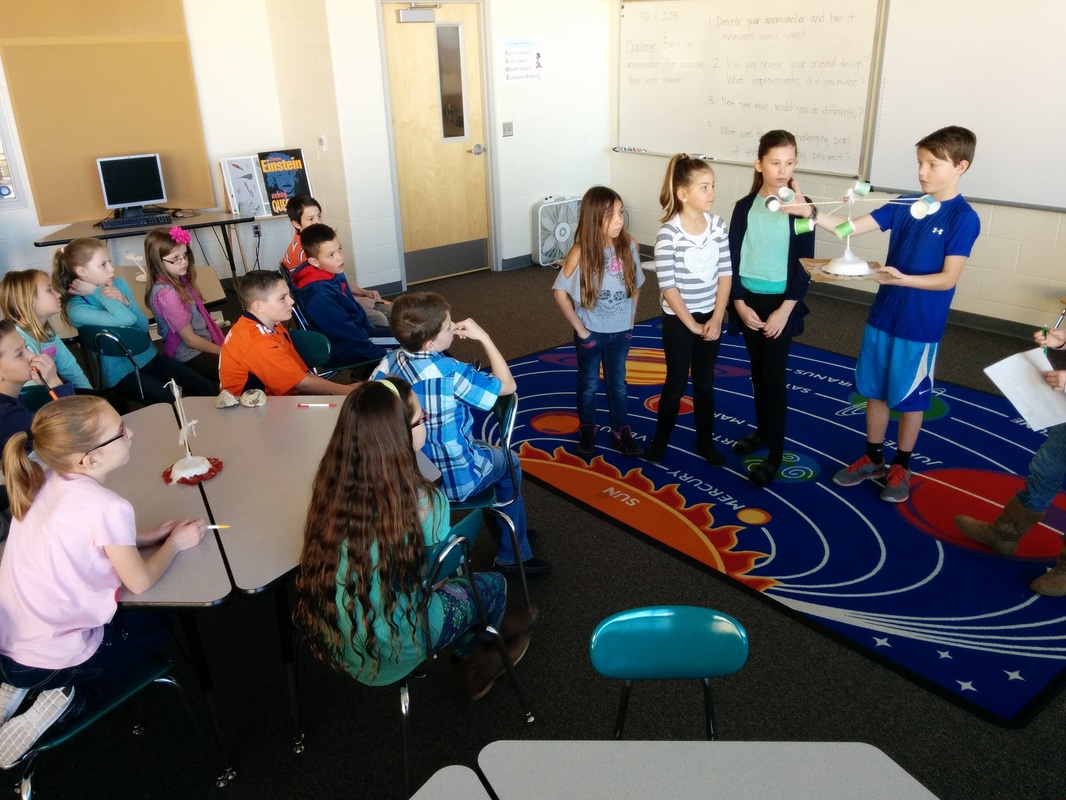
Evaluate: Student groups present their anemometer designs to the class (using prompts on the white board). We reflect on the 21st century skills we are developing. We are becoming problem-solvers, innovators, and collaborators!
Summative assessment probe: What Are Clouds Made Of? or Wet Jeans or Air Pressure or Hot and Cold Balloons.
Fun Fact: Data from satellites orbiting Mars reveal an unexpected pattern of temperature variation on the red planet (reference) that NASA scientists are now trying to explain. Maybe a young scientist from grade 4 will be the one to explain this strange phenomena!
Note: See NSTA journal article Wacky Weather for another great weather-related engineering project.
Note: See NSTA journal article Wacky Weather for another great weather-related engineering project.
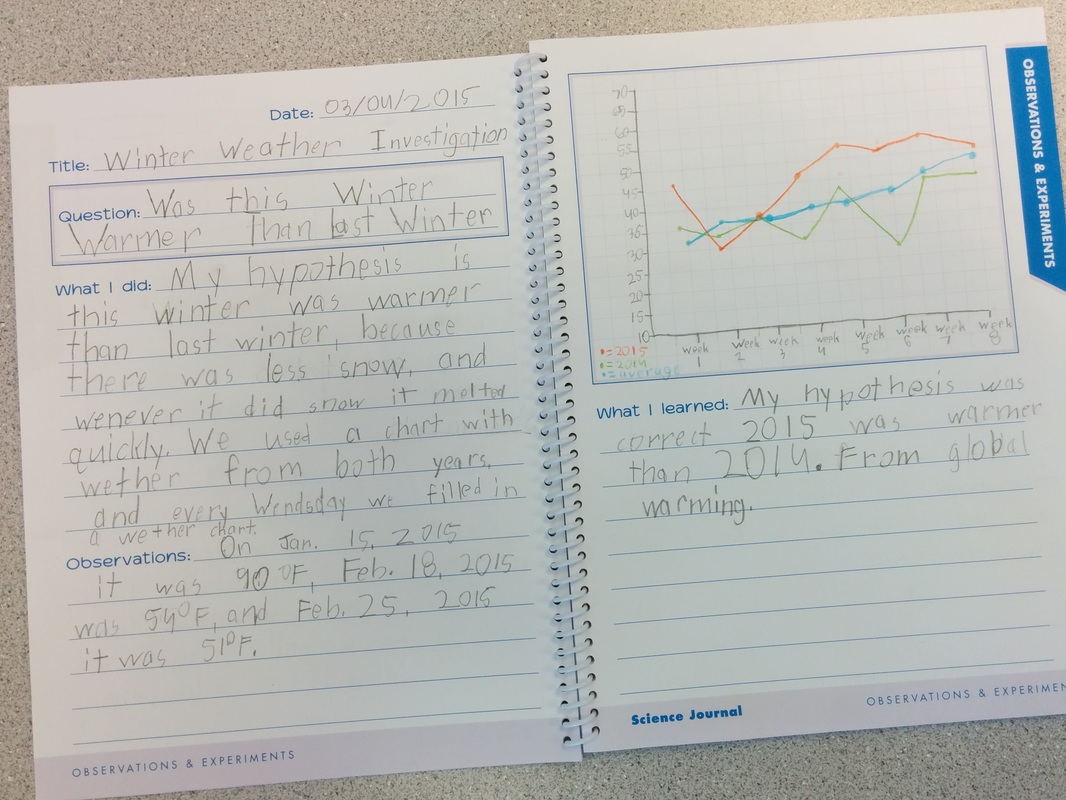
Explore: Record-breaking heat in Utah and complete lack of snow this winter prompted a student to post this question on our question board: Is the world getting hotter so we have to find somewhere else to live? We conduct a big data analysis to look for patterns in weather data, comparing current winter temperatures (orange line) to the long-term average temperatures (blue line). Students graph the results in their science notebooks.
Explain: Students read informational text to gather evidence that earth's climate is warming. They construct an explanation based on evidence for what is causing global warming.
Explain: Students read informational text to gather evidence that earth's climate is warming. They construct an explanation based on evidence for what is causing global warming.
More student questions posted on question board:
- Why can you only see your breath when it is cold?
- Is it possible for two snowflakes to be the same?
- How do snowflakes form?
- Why do snowflakes have six points?
- Why is the sky blue?
- Why are clouds white?
- What makes clouds turn pink at sunset?
- What causes a thunderstorm?
- Why does lightning catch things on fire?
- How many storms in the world can happen in a second?
- Is a tsunami the worst natural disaster?
- Where does the water go when you're drying your hair?
- Why don't lakes evaporate?
- What causes wind?
- If heat rises then why are mountains cold?
- Is the world getting hotter so we have to find somewhere else to live?
- What is global warming?
Standards:
S2.O1. Observe, measure, and record the basic elements of weather.
S2.O2. Interpret recorded weather data for simple patterns.
Weather describes conditions in the atmosphere at a certain place and time. Water, energy from the sun, and wind create a cycle of changing weather. The sun's energy warms the oceans and lands at Earth's surface, creating changes in the atmosphere that cause the weather. The temperature and movement of air can be observed and measured to determine the effect on cloud formation and precipitation. Recording weather observations provides data that can be used to predict future weather conditions and establish patterns over time. Weather affects many aspects of people's lives.
S2.O1. Observe, measure, and record the basic elements of weather.
- Identify basic cloud types (i.e., cumulus, cirrus, stratus clouds).
- Observe, measure, and record data on the basic elements of weather over a period of time (i.e., precipitation, air temperature, wind speed and direction, and air pressure).
- Investigate evidence that air is a substance (e.g., takes up space, moves as wind, temperature can be measured).
- Compare the components of severe weather phenomena to normal weather conditions (e.g., thunderstorm with lightning and high winds compared to rainstorm with rain showers and breezes).
S2.O2. Interpret recorded weather data for simple patterns.
- Observe and record effects of air temperature on precipitation (e.g., below freezing results in snow, above freezing results in rain).
- Graph recorded data to show daily and seasonal patterns in weather.
- Infer relationships between wind and weather change (e.g., windy days often precede changes in the weather; south winds in Utah often precede a cold front coming from the north).
Weather describes conditions in the atmosphere at a certain place and time. Water, energy from the sun, and wind create a cycle of changing weather. The sun's energy warms the oceans and lands at Earth's surface, creating changes in the atmosphere that cause the weather. The temperature and movement of air can be observed and measured to determine the effect on cloud formation and precipitation. Recording weather observations provides data that can be used to predict future weather conditions and establish patterns over time. Weather affects many aspects of people's lives.
 RSS Feed
